

.png)
.png)
Far too often, we see many business owners underutilizing their Google Analytics, or in some cases just not even using it. In today's world, data is king and using it in the right way can help you effectively scale your business. One of the main perks of Google Analytics is that it has a ton of key data that Shopify and your ad analytics tools don’t.
With the new release of GA4, you can really customize data reports and get a full 360 view of your analytics. In this article I'm going to cover how you can leverage GA4 to increase sales on your eCommerce store. Remember the goal here is to gain insights that you can use in your optimization efforts.
Dimensions and Metrics in Reports
Before we get started, we need to cover Dimensions and Metrics. You can customize GA4 reports and add Dimensions and Metrics to each one to gain more insight.
Metrics are your data metrics like ATC (Add to Cart), Transactions, Sessions, Users, CVR (Conversion Rate), ARPU (Average Revenue Per User) and more. Ecommerce metrics are not included in reports by default, so you will need to add them as we go through each report.
Dimensions are characteristics for users like Attribution, Demographics (Age, Gender, Location), Device/Browser + More. You can use these to segment data down and find out which audiences behave differently.
Here's a real example of using dimensions and metrics, we were looking at Product Performances, and when we added the "CVR" metric we saw that a particular product was converting 50% lower than other similar products. So we added a “Device” dimension to see which devices are converting the lowest on that particular product. We saw that Android is converting significantly lower, and found out that the product page was actually bugged on Android. We fixed the product page on that device, and the overall CVR of that product increased to normal. This is how you use dimensions effectively in your reports.
Now that we understand what Metrics and Dimensions are and how we can use them, we can go into the reports and find ways to optimize your store from them.
Identify underperforming Products and Collections
Reports > Monetization > Product Performance
This report can help you identify underperforming products and collections. Click the ‘Item Name’ dropdown to switch between products and collections (if configured). You can identify which products and collections are underperforming, and prioritize those in your optimization efforts.

(Report: Monetization > Ecommerce purchases: Item name)
Identify underperforming Landing Pages
Reports > Engagement > Landing Page
Similarly to the last report, this will help you identify underperforming landing pages. This will help you see your homepages CVR, AOV, and help you find low hanging fruits for optimization such as your advertorials, long scroll landing pages and more.
Click “Customize this report” and add key metrics like Bounce Rate, CVR, APR, and RPV to see which Landing Pages are underperforming.
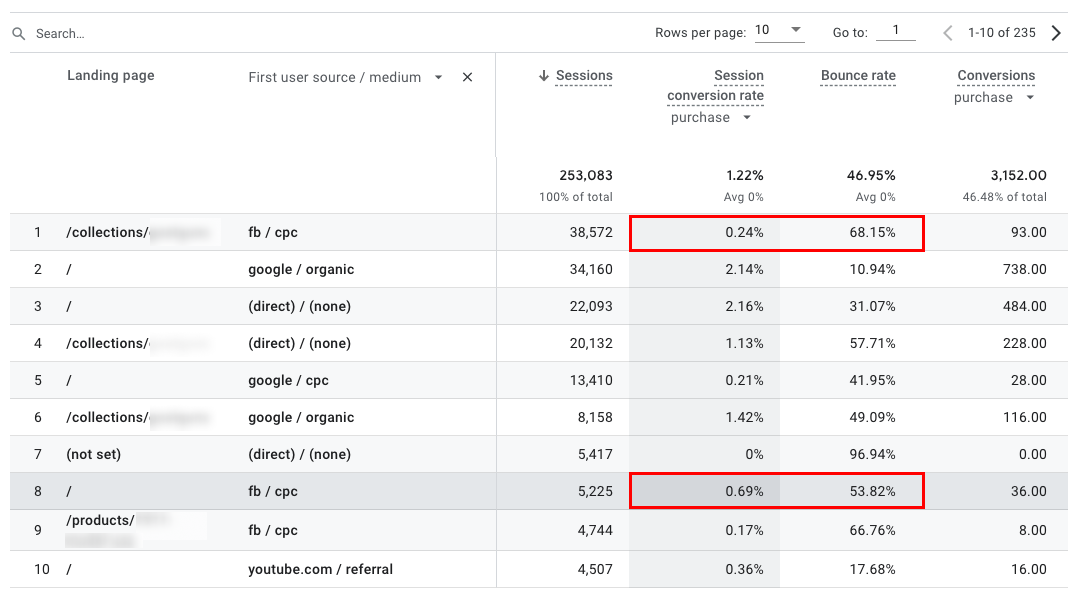
(Report: Engagement > Landing page, filter applied)
Identify underperforming Browsers and Devices
GA4 Reports > Tech > Tech details
Unless you have a QA team, and 20+ devices to test on, it’s unlikely you really know how your website is functioning across different browsers and devices. This report will help you identify which Browsers and Devices are underperforming.
Click “Customize this report” and add key metrics like Bounce Rate, CVR, APR, and RPV to see which Browsers and Devices are underperforming.

(Report: Tech > Tech details: Browser)
Identify underperforming Screen Resolutions
Reports > Tech Details > Select “Screen resolution”
Now while your website may work fine on your laptop, it doesn’t mean that it’s working the same for everyone on their laptop. There are over 15 common screen resolutions. This report will help you identify which resolutions are underperforming.
Click “Customize this report” and add key metrics like Bounce Rate, CVR, APR, and RPV to see which Resolutions are underperforming.
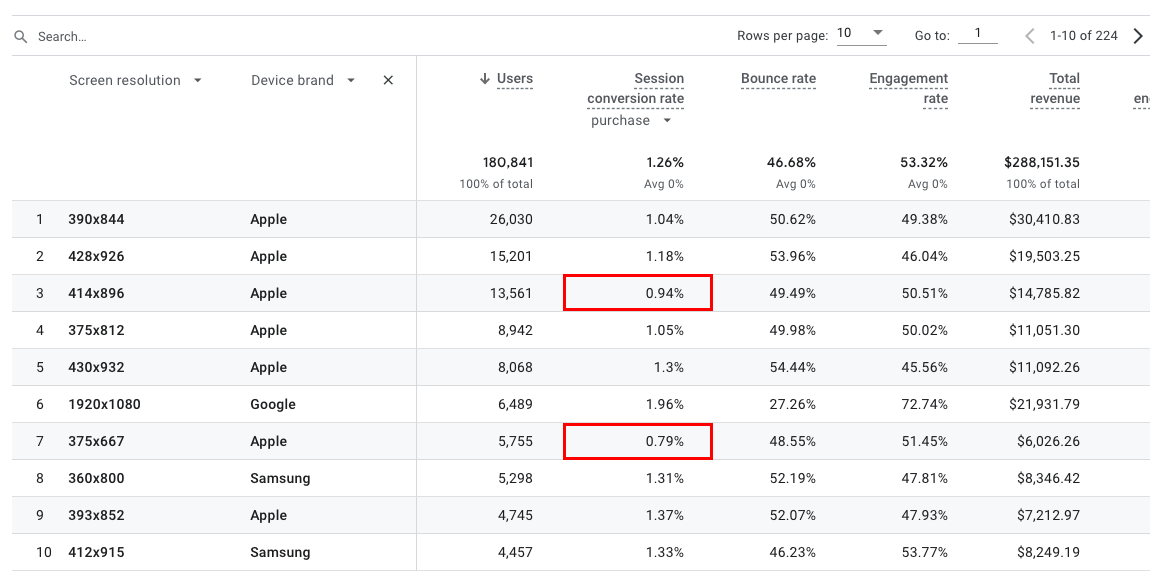
(Report: Tech > Tech details: Screen resolution)
Identify Drop Off Points in Checkout Funnel
GA4 Reports > Monetization > User Purchase Journey
This report allows you to see the entire checkout process from 'Add to Cart' to 'Purchase'. If there's a significant drop-off at any stage, you can start investigating possible causes. Maybe your shipping rates are too high, or there isn’t enough social proof on the checkout.

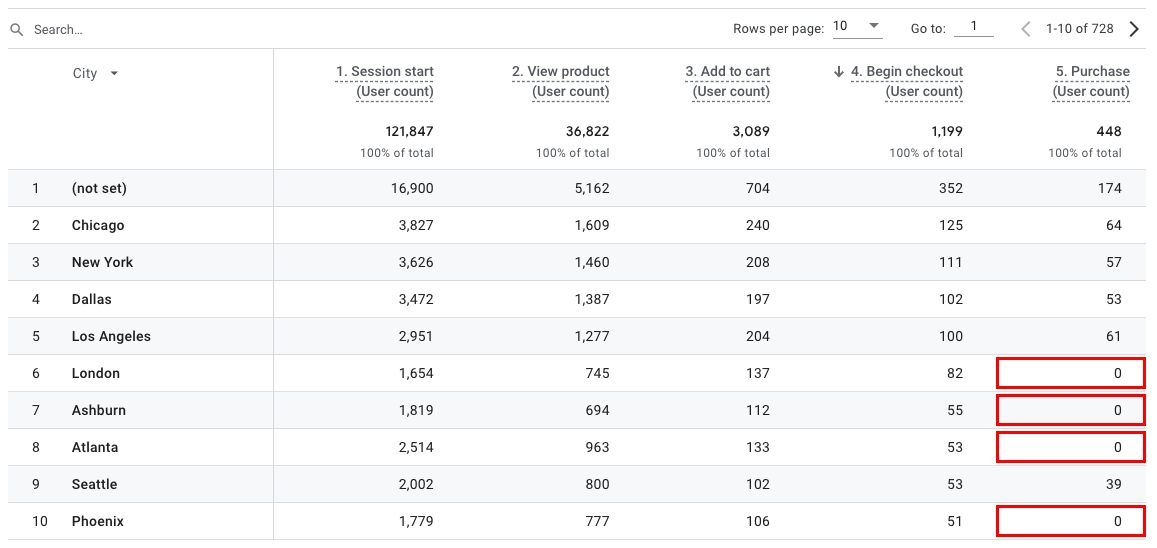
(Report: Monetization > User purchase journey)
Conclusion
Alright, wrapping up, harnessing the power of GA4 is a game-changer for your Shopify store. It's a treasure trove of insights that helps you spot the good, the bad, and the ugly.
But here's the key: data won't drive your business forward unless you act on it. So, don't just collect data, use it. Let GA4 be your compass guiding you to make smarter, data-backed decisions.

.svg)

.png)

.svg)
.svg)